Showcase projects
These are projects we made using vis, or ones we received from the community. If you'd like your project to be featured here, please post an issue on our Git page.
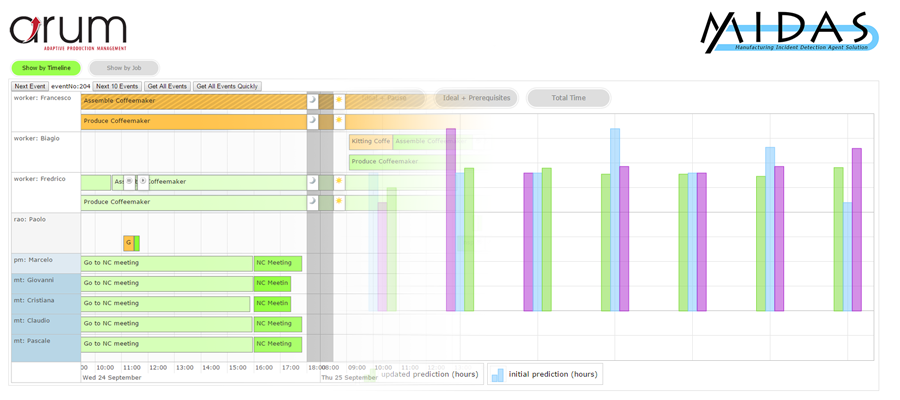
MIDAS, Almende BV
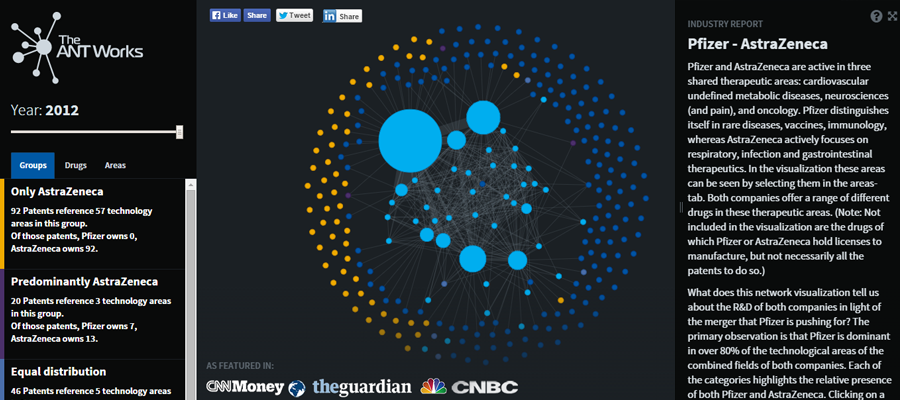
Pfizer, The ANTworks
This and the next entree are two case studies Jeroen Coumans created for a startup that specialises in patent analysis, and were featured on CNN Money, The Guardian, CNBC and the Financial Times.
Both fully use vis.js for graph rendering, while the frontend is built with React.
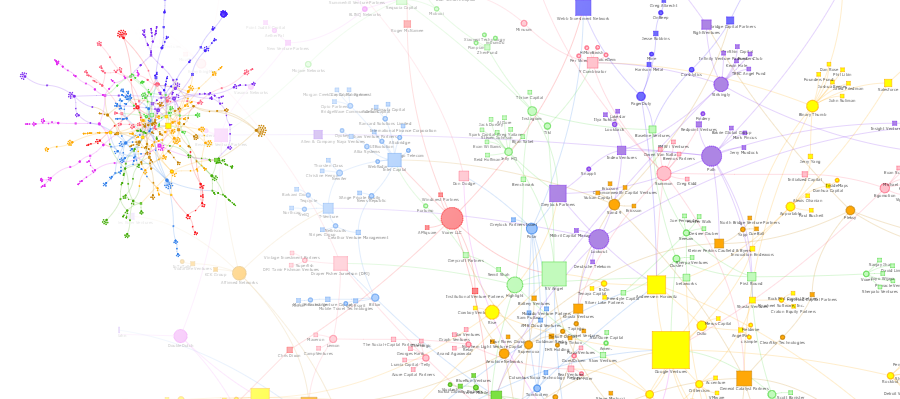
Connecting Startups and Investors in Mobile Technology: As you can see in the visualization, nodes have a high betweenness centrality when they are at the intersection of different clusters. In the case of investors (square nodes), this implies that an investor with a varied portfolio of mobile technology investments can serve as a key connector based on its participation in multiple sub-communities of the network.
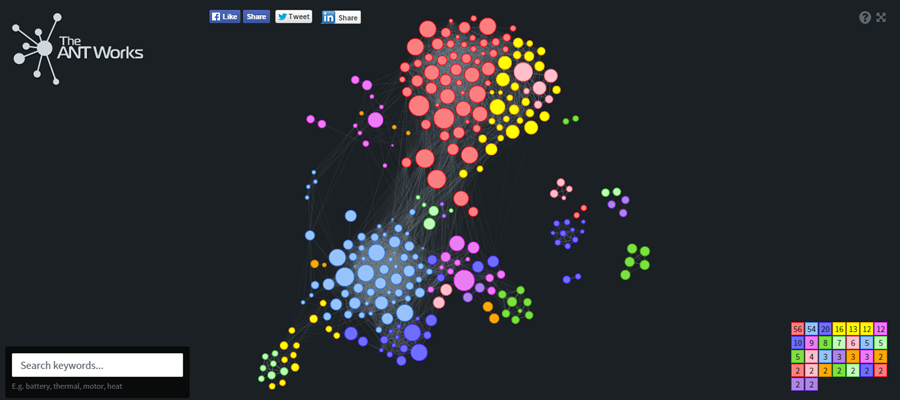
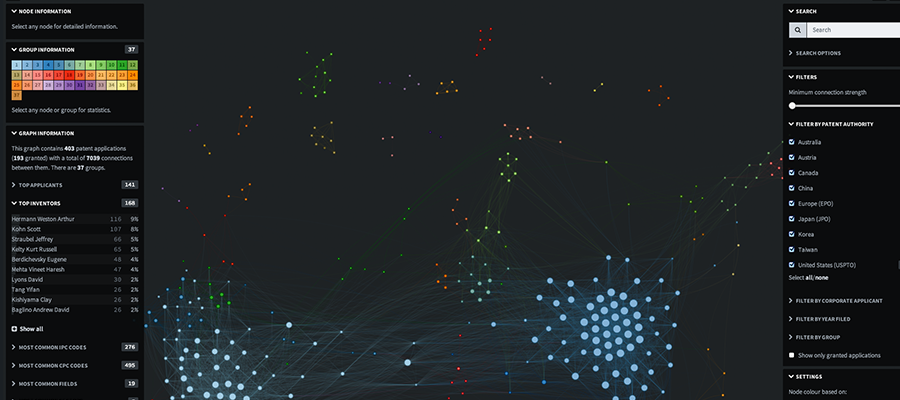
Tesla, The ANTworks
This and the previous entree are two case studies Jeroen Coumans created for a startup that specialises in patent analysis, and were featured on CNN Money, The Guardian, CNBC and the Financial Times.
Both fully use vis.js for graph rendering, while the frontend is built with React.
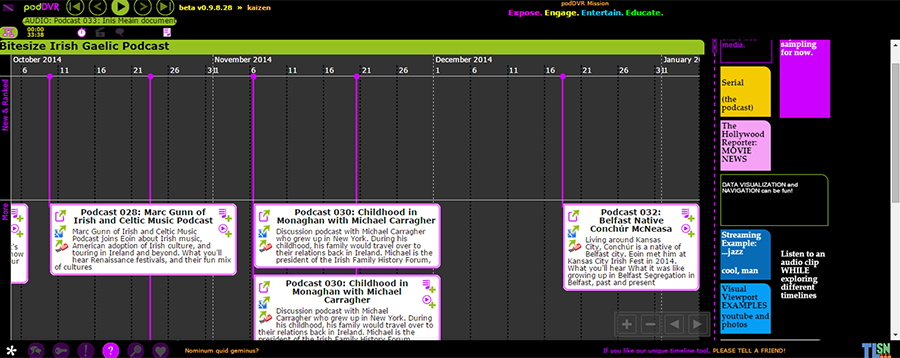
This is an one Page Web App enabling you to mark spots/segments of podcasts and easily share those highlights with friends. Podcasts are typically mp3 audio files obtained via RSS feed so we have integrated a media player with custom controls. Podcast episodes are presented in sequence over a navigable timeline, which is also used to visualize single episodes and/or highlights playing second by second.
Prototype, The ANTworks
These are a few screenshots from an upcoming project by The ANTworks, giving a great example of how the style of vis can be
customized.
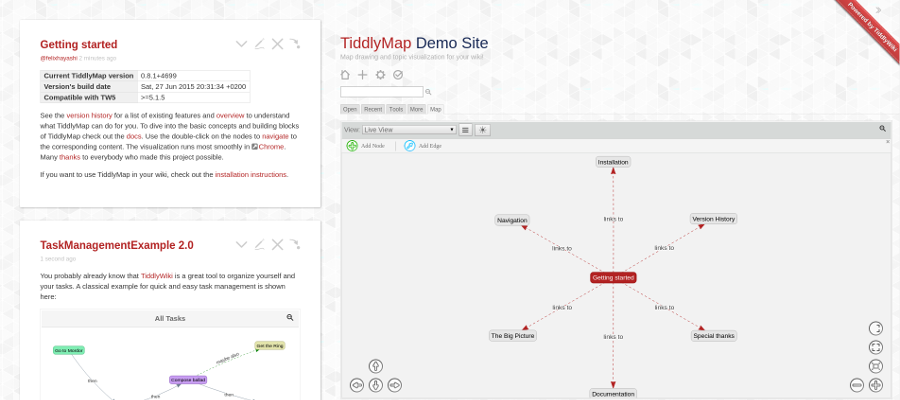
The open-source project TiddlyMap heavily draws on the Vis.js library to turn the personal note-taking software TiddlyWiki into a full-blown concept-mapping tool. Graphs may be embedded in the overall wiki content to accompany the text at any place and clickable nodes allow fast topic navigation. The resulting graph-wiki-hybrid makes it incredibly easy to integrate, link and visualize ideas.
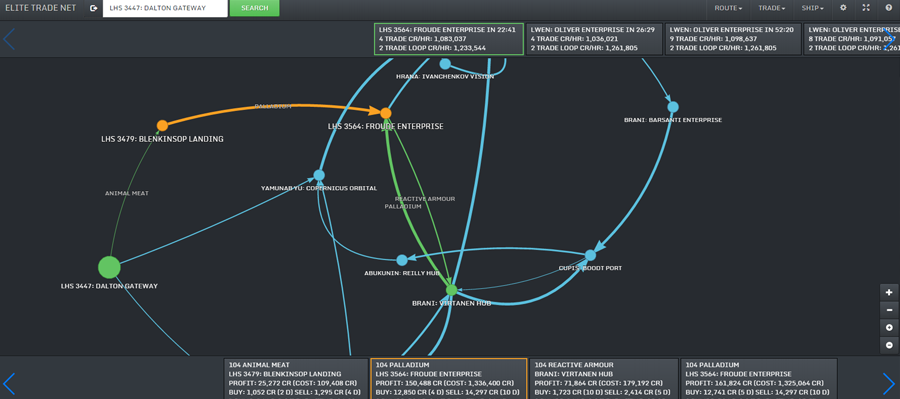
This is a tool for finding profitable trade routes in the game Elite: Dangerous. It uses the vis.js network module to display route options. Animation, select events and dynamic coloring enable graph navigation.
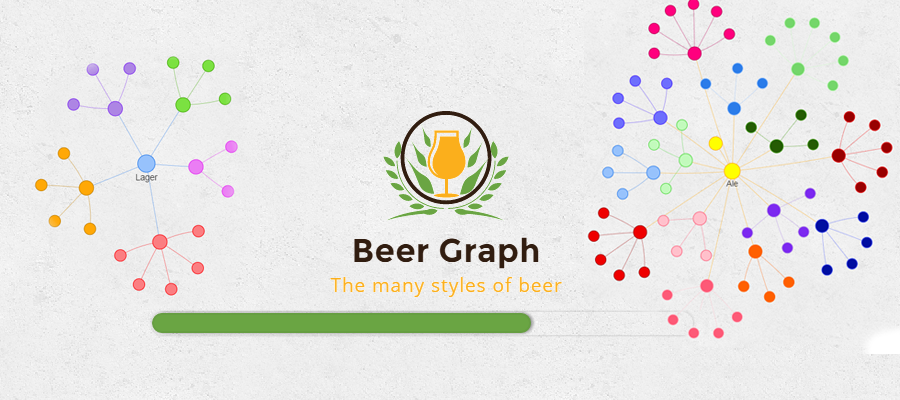
An application that shows the different styles of beers. Each beer style
with its own specifications, beers brands and beer family which it belongs
to.
Feel free to contribute your knowledge and build a better graph using the
forms.