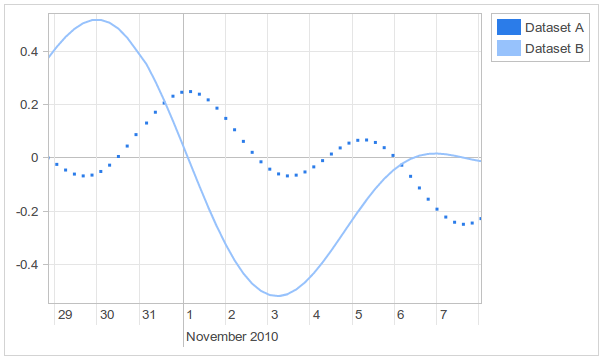
The Graph is an interactive visualization chart to draw (measurement) data in time. You can freely move and zoom in the graph by dragging and scrolling in the window. The time scale on the axis is adjusted automatically, and supports scales ranging from milliseconds to years. The Graph is specially designed for handling large amounts of data.