Graph3d Examples
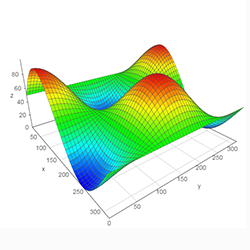
View all examples » View docs »This small code example shows the easiest way to get a Graph2d up and running. This code has been taken from example 1. The working example is shown next to it. Click it to start the interaction.
<div id="visualization"></div>
<script type="text/javascript">
// Create and populate a data table.
var data = new vis.DataSet();
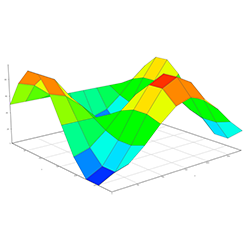
// create some nice looking data with sin/cos
var counter = 0;
var steps = 50; // number of datapoints will be steps*steps
var axisMax = 314;
var axisStep = axisMax / steps;
for (var x = 0; x < axisMax; x+=axisStep) {
for (var y = 0; y < axisMax; y+=axisStep) {
var value = (Math.sin(x/50) * Math.cos(y/50) * 50 + 50);
data.add({id:counter++,x:x,y:y,z:value,style:value});
}
}
// specify options
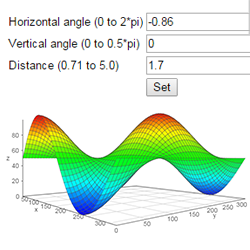
var options = {
width: '500px',
height: '552px',
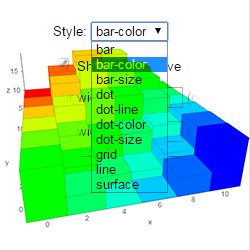
style: 'surface',
showPerspective: true,
showGrid: true,
showShadow: false,
keepAspectRatio: true,
verticalRatio: 0.5
};
// Instantiate our graph object.
var container = document.getElementById('visualization');
var graph3d = new vis.Graph3d(container, data, options);
</script>